How to create Google Forms reports

In an era where data is king, effectively analyzing and presenting the information gathered from surveys is vital. This article guides you through generating insightful reports from Google Forms using Google Sheets, and introduces 123FormBuilder as a potent alternative with enhanced reporting features. Let’s explore how to elevate your data reporting to the next level.
Generating Reports from Google Forms Data with Google Sheets
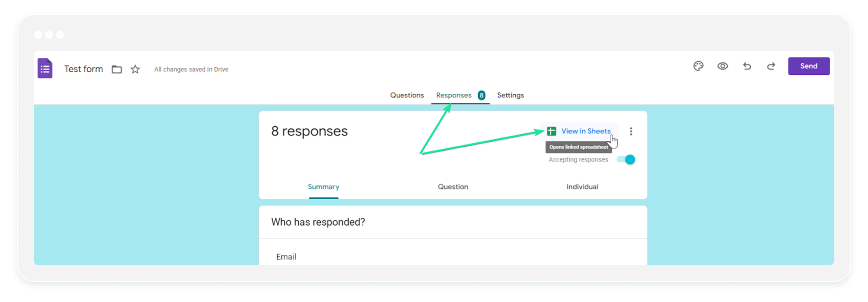
Responses submitted through Google Form are automatically collected and stored in a Google Sheets spreadsheet.
- To access the responses, go to the “Responses” tab in your Google Form and click on the “View in Sheets” button:
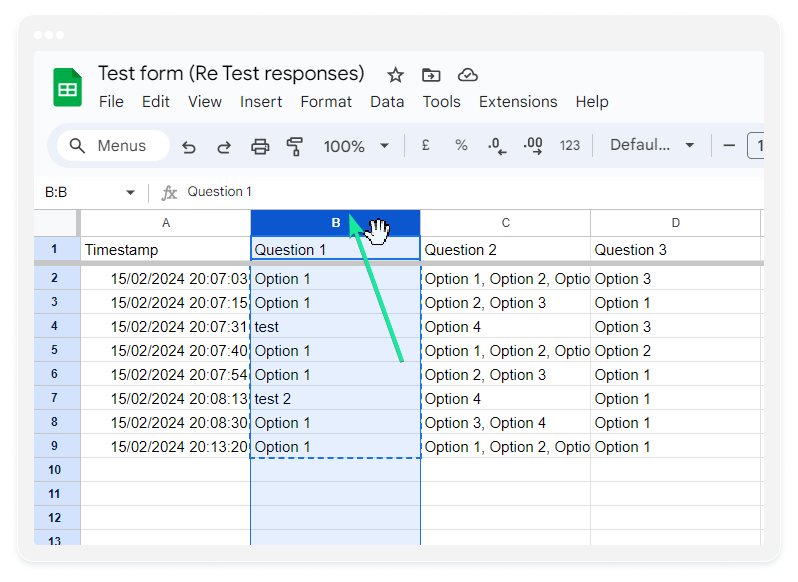
2. Click on the letter to select the entire column/question:
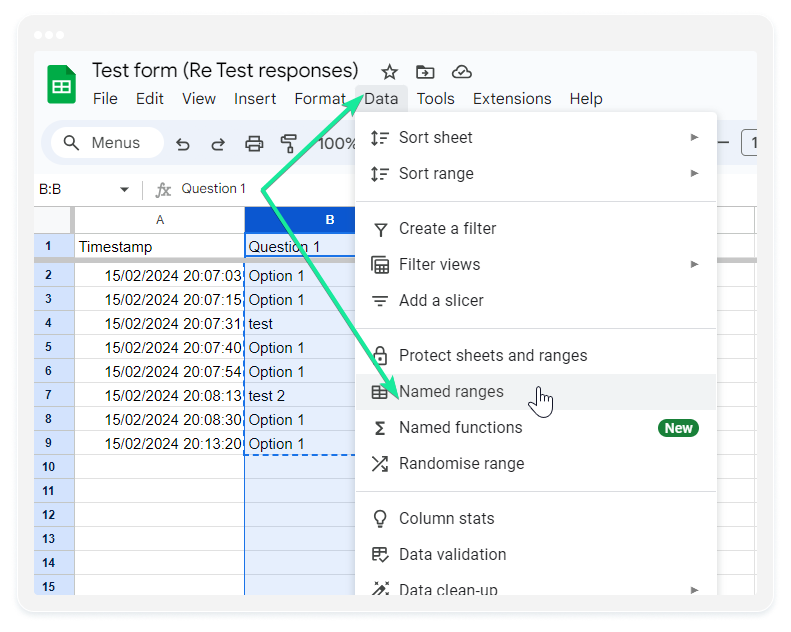
3. Go to Data → Named Ranges:
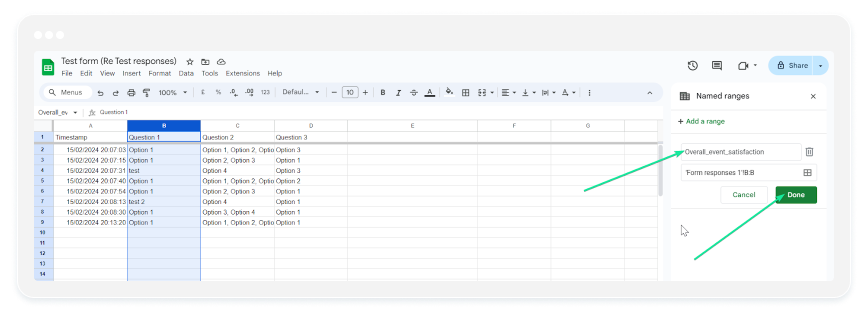
4. Add a range and enter as name something like “Overall_event_satisfaction” (be aware that the names can only contain alphanumeric characters and underscores, no spaces or punctuation, and they can’t start with a number):
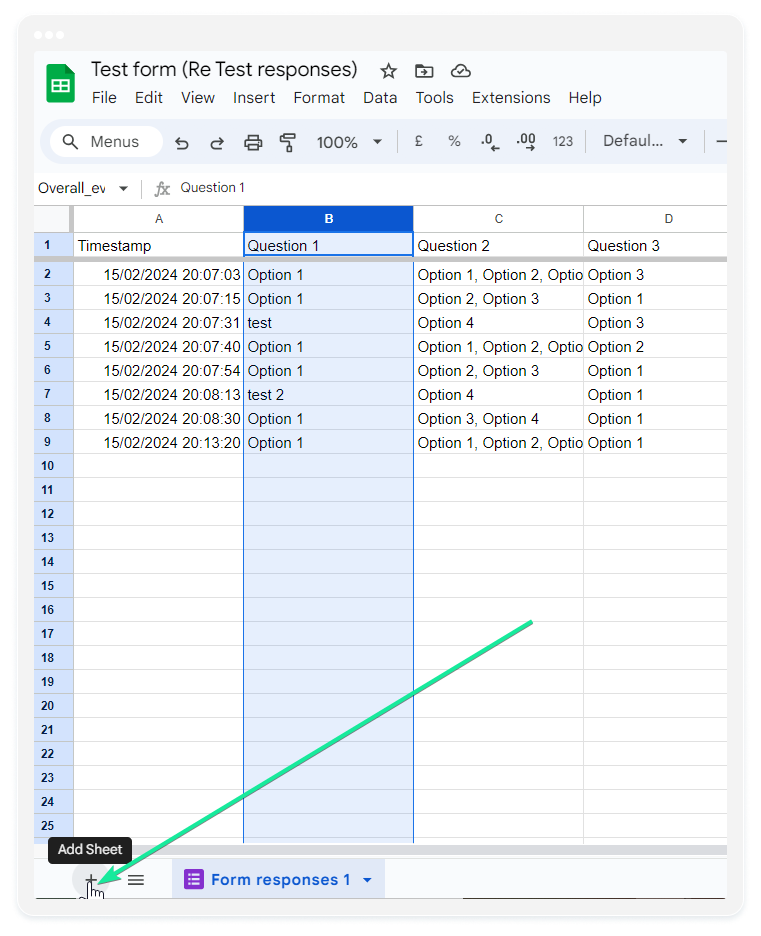
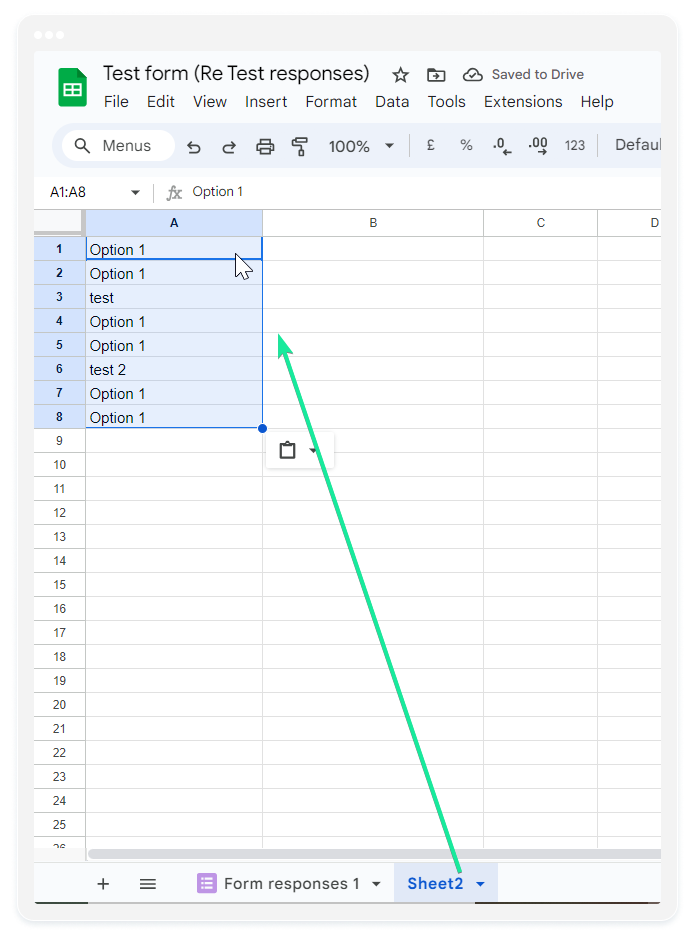
5. Add a new sheet to the spreadsheet and add the responses of the question in column A:
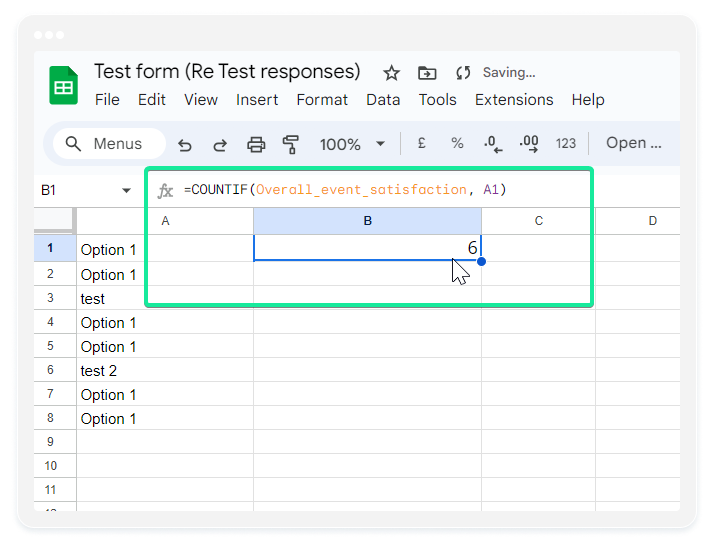
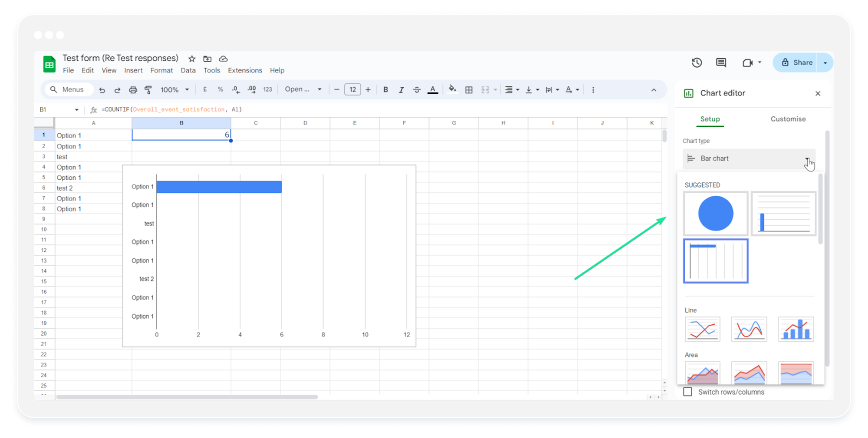
6. Enter =COUNTIF(Overall_event_satisfaction, A1) in the first cell of column B:
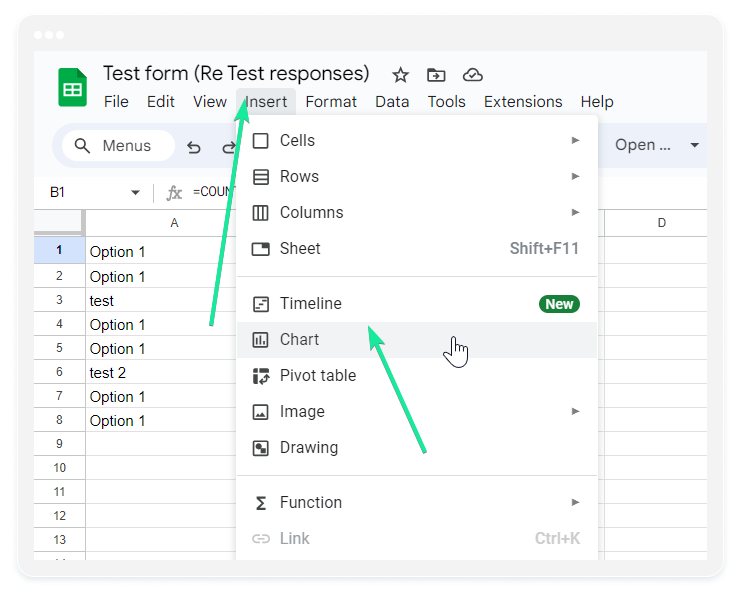
7. Go to Insert → Chart:
8. Select the Chart type:
Once your reports are ready, you can use the “Share” button in Google Sheets to invite specific people to view or edit the reports, or generate a shareable link to distribute the reports more widely.
By following these steps, you can effectively create reports from Google Forms data using Google Sheets, allowing you to analyze and present the collected information in a structured and meaningful way.
123FormBuilder Reports: A Superior Alternative to Google Forms
With 123FormBuilder, you can create Reports with Charts & Graphs, and you can customize reports to analyze and visualize the data collected through your forms in just 4 steps.
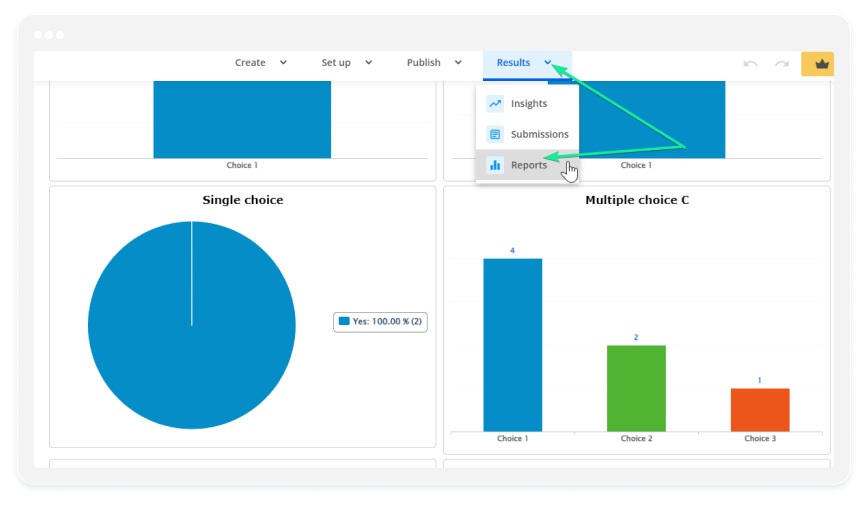
- Open your form in the editor and go to Results → Reports:
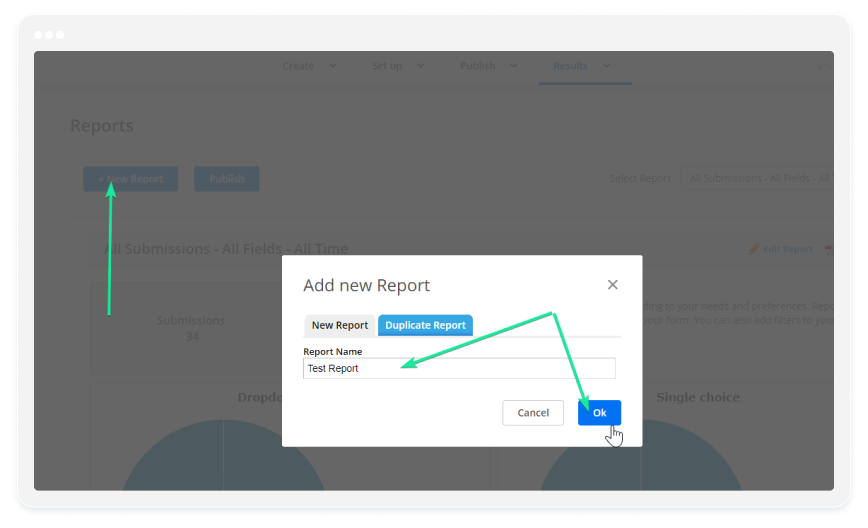
2. Go to New Report → rename your report → click Ok:
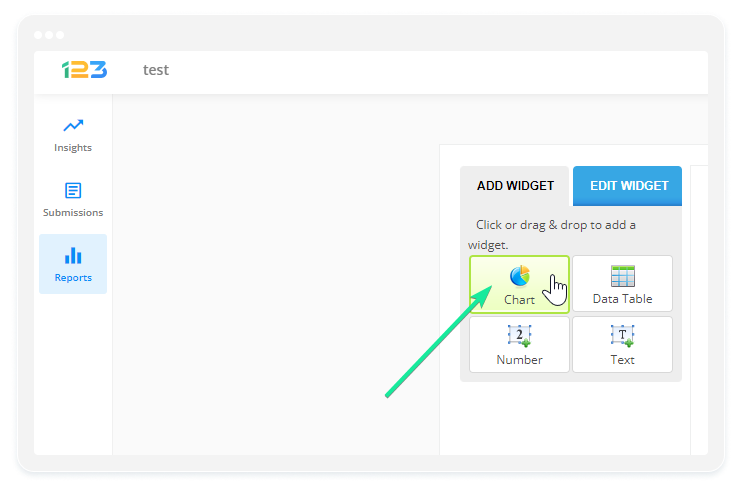
3. Add a widget. In our example, we will choose a Chart:
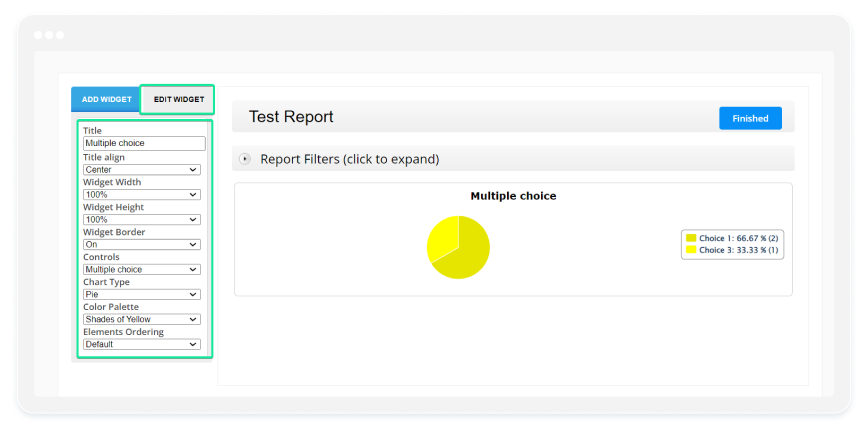
4. Edit the widget.
- select the chart type, add the question you want to display, choose the color palette, etc.
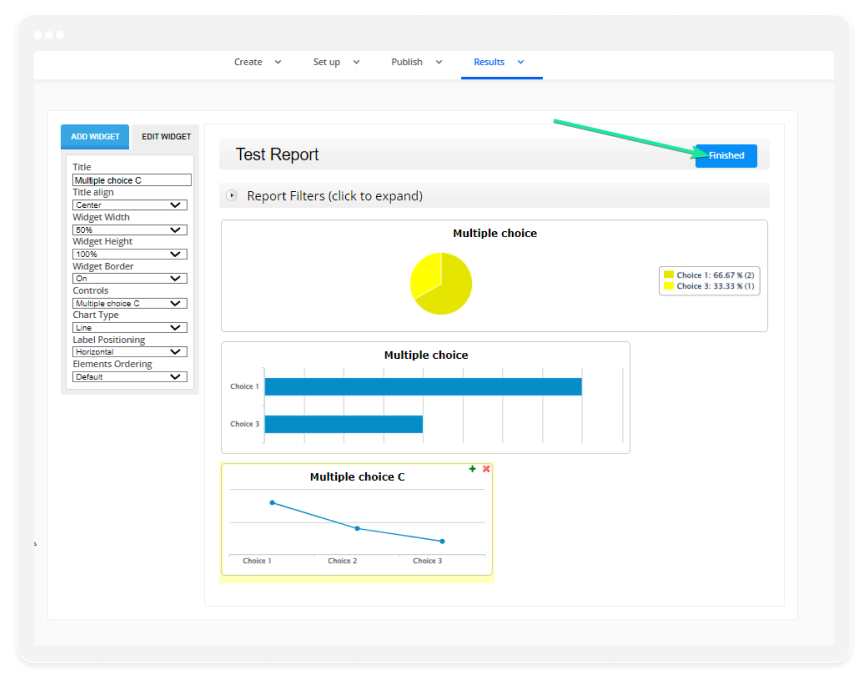
- add as many widgets as you need and click Finished:
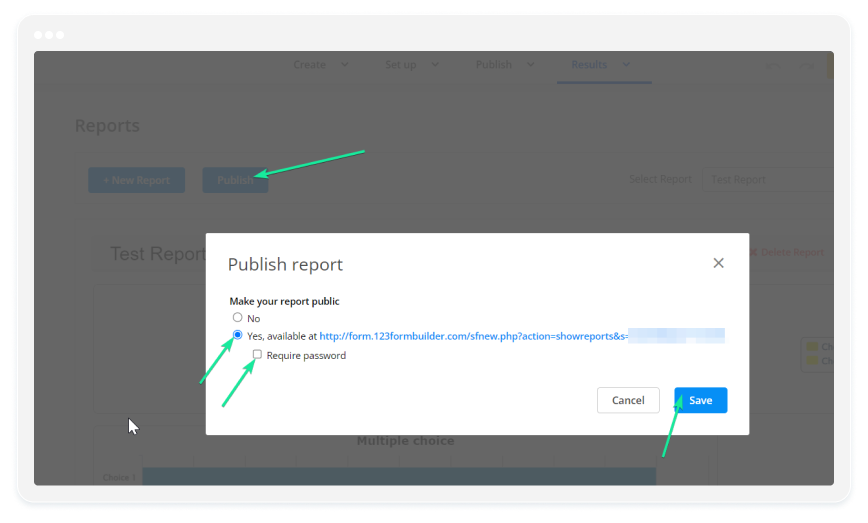
And that’s all! You can now Publish your report, or share its URL and also make it password protected:
Reports will update automatically after submission. Therefore, you don’t need to worry about updating them yourself each time you receive a new submission on your form.
Overall, 123FormBuilder offers a comprehensive set of reporting features to help you analyze, visualize, and share form data effectively. Whether you need basic graphical reports or advanced analytics capabilities, 123FormBuilder provides tools to meet your reporting needs.