123FormBuilder Knowledge Base
Search our documentation platform for answers, service specifications and 3rd-party integrations.
How can I interpret Insights data?
You’ve created your 123FormBuilder form and shared it with your respondents. Now you have gathered some views, even some submissions on your form. But how can you interpret Insights data? How can you use it to level up your form?
Form Insights – Navigation
You might have noticed that below the form stats, you have some clickable titles: Views/Submissions/Submission rate/Avg time to complete. All Insights data is filtered based on this selection. By default, Views is selected.

When you click on Submissions, the charts, the device, the referrer and the location card are refreshed to take into consideration the number of submissions. The same principle applies when Submission rate or Avg. time to complete is selected.
When Users or Abandon is clicked, we are updating the info shown in Insights charts in order to see the evolution of our form per day.
Note: keep in mind that currently, for Users & Abandons we are displaying only the Form insights cards, and charts, as they are not included in the Device, Location, Referrer cards.
Form Insights – Devices card
Let’s take the below example. Our form has gathered in total 38 views and 7 submissions and we have Views selected by default.
By using the devices card, you can see from which devices your respondents have viewed and submitted the form from. In the below example, the most used device for viewing the form is Desktop: 32 views, representing 84% of the total views.
You can hover on the pie chart to see the allocation of each type of device for your Views.
When switching to Submissions, the pie chart will reload in order to take into consideration the number of submissions per each type of device. Each slice from the pie chart will represent the percentage of submissions per each device. On hover, you can see the number of submissions for each device.
The same principle applies for Submission rate. On a bar chart, you have the submission rate represented for each type of device. On hover on each bar column, you have the type of device and it’s submission rate.
When Avg. time to complete is selected, the bar chart is reloaded to take into consideration the average time to complete per each device. On hover you can see the type of device and the average time to complete per each type of device.
How can Devices card information help me?
Let’s continue with the above example. Our form has registered a lot of views from Desktop devices (32) and only 2 submissions. This means a submission rate of 6.25%. Pretty low, if we are comparing it with Mobile or Tablet devices, isn’t it?
This should be making us thinking: what is happening with my form when it is viewed and completed from a desktop device? Is there an issue with the type of fields, with how it looks? Is the submit button not visible on desktop device? Or is there any other issue that I’m not aware of?
You can figure this out by going to the Preview section and playing around with all the devices. Dig deeper in the layout of your form and see what is causing problems to having it completed.
Now that you have figured out where the issue is, make the necessary adjustments and test it out once more. Sit back, relax and let your form gather more submissions.
Form Insights – Referrer card
Let’s take the below example. Our form has views and submissions registered on multiple referrers. If there are more than 3 referrers, you will have the option of expanding the list in order to see them all.
If we can not detect the referrer, we use the placeholder No referrer, like below.
When Views is selected, the pie chart will represent the top 3 referrers. Each slice of the pie chart shows the number of views and the appropriate referrer.
The same principle applies when Submissions is selected. Each slice of the pie chart shows the number of submissions per each type of referrer.
When Submission rate is selected, the pie chart is changed to a bar chart. When hovering over the column chart, you can see the referrer and the submission rate registered for that specific referrrer.
The same principle applies for when Avg. time to complete is selected. For each referrer, you can see the average time it took your respondents to complete the form.
How can Referrer card information help me?
By analysing each referrer’s performance, you can figure out which one is the most successful. Let’s say that you have shared your form on social media, on email and you have also embedded it in your website.
If the views registered for your form when embedded are higher, but submissions very low, this might mean that your respondents have difficulty completing it on your website. Now it’s time to dig deeper and see where the stopper is.
Maybe one channel is more successful than another, so this might be the key of getting as many submissions as possible.
Form Insights – Location card
Following the same pattern, location card shows you from which countries your form has registered views and submissions.
When Views is selected, the map will be have the countries from which your form registered views coloured. On hover, you can see the name of the country and the number of views registered from that country.
The same principle applies for all other information: Submissions, Submission rate, Avg. time to complete.
How can Referrer card information help me?
If your form is meant to collect submissions from multiple countries, here you can see which country is performing better.
Let’s say a country is registering a lot of views, but no submissions. In this case, you should verify if the translations have been made correctly.
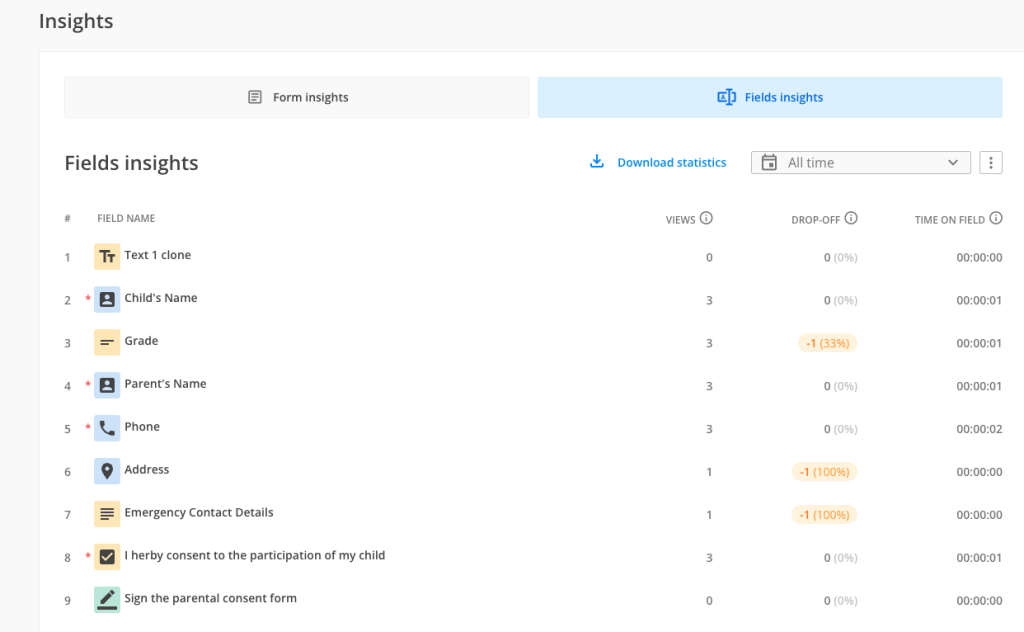
Fields Insights
Fields Insights section is available starting with 6 September 2023. Fields Insights section is meant to provide you in-depth form analytics performance per each question that you currently have on your form.
For more information on how Fields Insights section works, please check out this article.
Related articles
How can Insights section help me?
Similar Articles
Frequently Asked Questions
Here is a list of the most frequently asked questions. For more FAQs, please browse through the FAQs page.